Tuesday, May 7, 2024

ICT AM NY Session A+ Setup based on Quarterly Theory | Darya Filipenka

People have been asking me to share my strategy. No, I do NOT overcomplicate things. I'm simply demonstrating how straightforward it can be. My strategy is primarily based on the Power of 3 concept that you can find on @I_Am_The_ICT YouTube Channel.
 
ICT New York Morning Session A+ Setups based on Quarterly Theory:
Between 8:15 and 8:38 am (EST/EDT; during the Q3 micro cycle) look for a ICT Unicorn Setup.

I've made some additions to my trading arsenal since @traderdaye introduced the Quarterly Theory, but I've been using this setup since February 2023. I didn't have a name for it initially, but Quarterly Theory seems fitting to me.

I hope you can gain some new insights from my findings, which I've been diligently working on for almost a year. Nevertheless, the core of my strategy can be found on @traderdaye page and
@I_Am_The_ICT YouTube Channel.
  

Monday, May 6, 2024

Typical May Up Early, Weak Middle, Strong Finish | Jeff Hirsch

Over the last 21 years, the first three days of May have historically traded higher, and the S&P 500 has been up 18 of the last 26 first trading days of May. 
 
Bouts of weakness often appear around or on the fourth, sixth/seventh, and twelfth trading days of the month while the last four or five trading days have generally enjoyed respectable gains on average, but the last day of May has weakened noticeably with only NASDAQ gaining ground.


Monday before May monthly option expiration (Monday, May 13) is much stronger than monthly expiration day itself
(Friday, May 17) albeit weaker for small caps. S&P 500 has registered only ten losses in the last thirty-four years on Monday. Monthly expiration day is a loser nearly across the board except for Russell 2000 with a slight average gain (+0.01%). 
 
The full week (May 13-17) had a bullish bias that is fading in recent years with DJIA down seven of the last eight and S&P 500 down six of the last seven. 
 
The week after options expiration week (May 20-24) now tends to favor tech and small caps. NASDAQ has advanced in 24 of the last 34 weeks while Russell 2000 has risen in 26 of the last 34 with an average weekly gain of 0.88%.
 

 April was the first down month in 6 months. Almanac readers know April is the best Dow month by average percent change and #2 for S&P. It’s ranked fourth for average percent change on NASDAQ and Russell 2000.

In general, April is a notoriously bullish market month overall with a high average percent and plurality of gains across the board. A negative April is cause for concern. When the #1 Dow month is down that could be significant.

Digging into the data in the tables below of all down Aprils since 1950 there is a plethora of red in May and through Q2 and Q3. There are several steep drops scattered throughout these 21 down April years. May, Q2 and Q3 show consistent and average losses.

Q4 however delivered solid gains except for four years: 1973 (Watergate, Vietnam, Oil Embargo), 1987 (Crash), 2000 (Undecided Election) and 2012 (ZIRP, QE3, Operation Twist, Big Q1 & Q3). You can see why we expect the market to struggle for the next several months.
 
Quoted from:
 
 In Bull Markets, New Moons are Bottoms, and Full Moons are Tops. 
In Bear Markets, New Moons are Tops, and Full Moons are Bottoms.

Saturday, May 4, 2024

The Great Replacement - Europe has fallen | Eva Vlaardingerbroek

Their message is clear. Our way of life, our Christian religion, our nations, they have to go without exception. Their vision of the future is the neoliberal, unrecognizable Europe, where every city becomes kind of like Brussels. Ugly, dirty, unsafe, zero social cohesion. And what are we left with? A permanent state of isolation, confusion and disorientation. 

» Everyone who has eyes can see it:
The native white Christian European population is being replaced at an ever-accelerating rate.«
 
[...] So what's the antidote? A strong Christian Europe of sovereign nation states. That's why we need to outright reject the lie that nationalism causes war. It's not nationalism or national sovereignty that causes war. It's expansionism. And where in Europe do we find that nowadays? In one place and one place only: Brussels. Isn't it funny how the same people who erode our national sovereignty are now telling us that we need to spend billions and billions of euros on the national sovereignty of Ukraine?

» I am going to draw the forbidden conclusion:
The Great Replacement Theory is no longer a theory.«  

[...] During a recent interview I got asked: "Do you think that you ever go too far? Do you think that you're ever too radical?" I thought about it for a second and said: "No, I don't think I go too far." Truth be told. I think we in Europe do not go far enough. I think that if we really think about the organized structural attack on our civilization, that we don't do enough. Do we do enough to stop the attack on our families, on our continent, on our countries and our religion? When we hear about another murder, another stabbing of a young innocent child, do we do enough? When we know that our national sovereignty has been given up in Brussels, do we do enough? When we hear that Christian kids in Germany are now converting to Islam to fit in, do we do enough? I don't think so. 
 

The totalitarian institution of the European Union needs to come down. Let me be clear, I don't believe in reforms. When the foundation of your institution is rotten, and that is the case in Brussels, you can rebuild the house on top of it all you want, but it's still going to crumble. So the only answer is: The Tower of Babel needs to be destroyed! We are the daughters and sons of the greatest nations on Earth. And we need to ask ourselves, what has happened to us? Where do we come from? And more importantly, where are we going? 
 
Our elites have declared a war on us, and now it is time for us to put on the full armor of God, fight back and win.  
 
 
April 25, 2024
 
"The Islamic New World Order is Here - Europe has fallen."
Speech at the 'Conservative Political Action Conference' in Budapest, Hungary.

Thursday, May 2, 2024

The Kremlin's Last Warning | Martin Armstrong

Dmitry Konstantinovich Kiselyov (born 1954) is a major TV host, and his latest warning to the West is to issue an ultimatum to the UK and the US. On Russian TV, Kiselyov warned [on April 29, 2024] that if a Western power deploys soldiers on the ground in Ukraine to inflict a strategic defeat on Russia, it will result in Armageddon. Of course, what I find stunning is how the Western press characterizes him as “Vladimir Putin’s propagandist,” and the implication of those words is that they are not a real threat. 
 
» Then the very moment would come. ‌«
RS-28 Sarmat [dubbed 'Satan II' by NATO] is Russia's most capable hypersonic thermonuclear intercontinental ballistic missile (ICBM). With a range of 18,000 km and traveling 27 times the speed of sound, Sarmat can extinguish any target/country/enemy anywhere on the planet within minutes with one single strike. Including the US - May 1, 2024.

The press takes NOTHING said from Russia seriously – it’s all a joke, just propaganda. [...] Kiselyov is not going to say this on national TV without the Kremlin actually delivering this warning. He said:  If NATO countries send their troops into Ukraine in order to inflict a strategic defeat on Russia, then the very moment about which Putin once said, Why do we need the world, if there is no Russia in it? would come.‌

» Russia can turn the US into radioactive ash. This is not propaganda. ‌«
Dmitry Kiselyov, delivering the Kremlin's last warning - April 29, 2024

Russia has indeed threatened to turn the US into radioactive ash and sink Britain below the waves. While some NATO leaders have been more circumspect, this need for war to justify the defaulting on debt that is the real factor behind the West’s desire for war will have far greater consequences than these fake world leaders who are all hand puppets of the Neocons. Kiselyov added: This is not propaganda. Yet in the West, the Neocons are saying this is a bluff, and Putin will never use nukes so the West can completely destroy Russia – their hated enemy for decades, without a shot fired.

Quoted from:
 
» There seems to be a conspiracy in the British Isles. Why threaten boundless Russia with nuclear weapons while sitting on a small island? The island is so small that one Sarmat missile is enough to sink it once and for all. This is just one launch, and there is no England, once and for all! Another option to plunge Britain into the abyss is the Russian Poseidon. There is no way to stop this underwater drone. It has a warhead with a capacity of up to 100 megatons. The explosion of this thermonuclear torpedo off the coast of Britain will raise a giant wave up to 500 meters high. Such a squall of water is also a carrier of extreme doses of radiation. Passing over the British Isles, it will turn what may be left of them into a radioactive desert. ‌«
Dmitry Kiselyov - May 2, 2022.

Tuesday, April 30, 2024

Solunar Rhythm, Cosmic Cluster Days & Sensitive Sun Degrees | May 2024

 
The SoLunar Rhythm in May 2024.
 [ oftentimes true : ]
New Moons mark beginnings of cycles, Full Moons mark completions.
In Bull Markets, New Moons are Bottoms, and Full Moons are Tops. 
In Bear Markets, New Moons are Tops, and Full Moons are Bottoms.
 
ooo0ooo
 
2024 Feb 25 (Sun) = Low
2024 May 26 (Sun) = High
2024 Jun 11 (Tue) = Low
 
ooo0ooo
 
 Apr 26 (Fri)
May 15 (Wed)
May 26 (Sun)
Jun 16 (Sun)
 
2024 04 26 (Fri) = SUN @ 6 TAU = 36 degrees = negative = low
2024 05 01 (Wed) = SUN @ 12 TAU = 42 degrees = neutral
2024 05 08 (Wed) = SUN @ 18 TAU = 48 degrees
= negative = low
2024 05 19 (Sun) = SUN @ 19 TAU = 59 degrees
= neutral
2024 05 25 (Sat) = SUN @ 5 GEM = 65 degrees
= negative = low
2024 06 06 (Thu) = SUN @ 16 GEM = 76 degrees = neutral

Friday, April 26, 2024

Cosmic Cluster Days | May - June 2024

Cosmic Cluster Day
 
|   Composite Line Cosmic Noise Channel
= Full Moon | = New Moon
 
Cosmic Cluster Days have no consistent polarity nor directional bias. Swing highs and lows also inside of the 'noise channel' may correlate with market directions and reversals. Upcoming Cluster Days are: 
 
Apr 26 (Fri)
May 15 (Wed)
May 26 (Sun)
Jun 16 (Sun)
Jun 26 (Wed)
Jun 28 (Fri)
Jul 04 (Thu)
 
More background information on the author, concept and calculation of Cosmic Cluster Days HERE.

S&P 500 Cycle Analysis | Steve Miller

Does history make a case that Bitcoin has topped? | Peter L. Brandt

Judge for yourself. It’s called Exponential Decay — and it describes Bitcoin. I hate being the bearer of bad news, but data are data. The fact is that the bull market cycles in Bitcoin have lost a tremendous amount of thrust over the years. You may like the story of this data or not — but you will have to deal with it (or at least account for it, adjust for it or just plain ignore it). In fact, I don’t like the Exponential Decay occurring in Bitcoin — Bitcoin is one of my personal largest investment positions.


There have been four major bull cycles in Bitcoin, with the current advance the fifth major bull cycle [the advance from cycle low to cycle high shown in brackets].

    Dec 21, 2009 to Jun 6, 2011 [3,191X advance]
    Nov 14, 2011 to Nov 25, 2013 [572X advance]
    Aug 17, 2015 to Dec 18, 2017 [ 122X advance]
    Dec 10, 2018 to Nov 8, 2021 [ 22X advance]
    Nov 21, 2022 to xxx x,, yyyy [high so far is $73,835 registered on Mar 14, 2024]

Now, here is where Exponential Decay is showing its ugly head.

    The magnitude of the 2011-2013 was approx. 20% of the 2009-2011 cycle
    The magnitude of the 2015-2017 was approx. 20% of the 2011-2013 cycle
    The magnitude of the 2018-2021 was approx. 20% of the 2015-2017 cycle

Worded another way, 80% of the exponential energy of each successful bull market cycle has been lost. Applied forward, this would indicate that the current bull cycle will experience an an exponential advance of approximately 4.5X or so (80% of the 22X of the 2018-2021 cycle). Taking a low for the current cycle of $15,473 projects a high for this cycle of  $72,723 — guess what — a price that has already been reached.


Well, you will ask, what about the halving? Prices have exploded upwards after every previous halving. And that may happen again. But for now we need to deal with the fact of Exponential Decay. It has happened. It is real. You may not want to believe it, but I place a 25% chance that Bitcoin has already topped for this cycle.

If Bitcoin has topped, what’s next you might ask. Of course I have no clue. But, if Bitcoin has topped I would expect a decline back to the mid-$30s, or the 2021 lows. From a classical charting point of view, such a decline is the most bullish thing that could happen from a long-term view. If you want to see an example of such a chart structure, look at the Gold chart from August 2020 to March 2024.

Do I believe the analysis just presented? I don’t want to, but the data speak for itself.


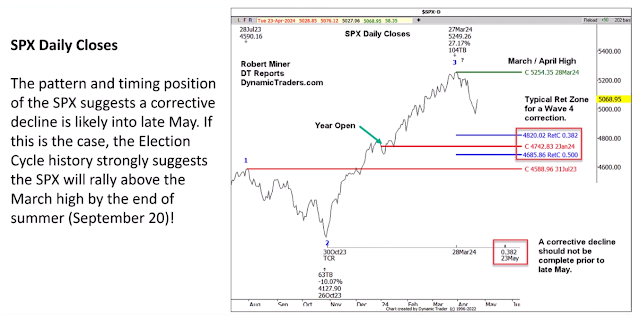
The S&P 500 and the Election Year Cycle | Robert Miner

I am recording this on April 25th and am going to talk about the S&P 500 and the election cycle today. [...] Within the next three weeks there is going to be one of the best setups within the entire election cycle. This is a setup that since 1952 had only one minor losing year (less than -1%). 
 
 
In the above chart the dark black line is the average of all election years since 1952. The gray line is the average of all election years since 1984. The red line is 2024 up to past week.


[...] The second chart just covers the beginning of March through September period of the election years. The blue line is the average of all  election years since 1952. In the first chart we saw the entire year, where the first part of the year is usually fairly negative. On average, we can see this distinct dip into the middle of May.


[...] Here are just two key pieces of information from the election year study from the spring until the end of summer. Number one, the 'summer low' is usually made around the second half of May to the first half of June. So that summer low probably hasn't been made yet. It sort of implies that the S&P is likely to be sideways to down into the second half of May. At least that is based on the averages of election years. Number two, in every election year, when the first quarter was strongly bullish (which it was in 2024), the S&P traded above the March high by September 20th - except for the year 2000, when the summer high came within just seven points of the March high by September 20th.


If the S&P happens to be sideways to down for the next few weeks, we know that the bias is overwhelmingly strong and bullish and that the S&P should then trade above the March high
before September 20th. The March high was the high of the year so far, and it is more than likely that the S&P will go sideways to down in the next few weeks. A correction would not be complete prior to May 23rd to 38% time retracement.


See
also:

Wednesday, April 24, 2024

S&P 500 Strength into May 1st & Weakness through Mid May | Larry Williams

Larry Williams expects U.S. stock market strength through May 1 (Wed) and weakness to follow through the middle of May.
 

That weakness could be followed by a relief rally into early June, then another leg down in July. “I am heavily short here,” he says. He expects a strong end of the year as a rally gets under way in early September. 


Monday, April 15, 2024

Top Reasons to Exit S&P Short Positions Soon | Allen Reminick

The S&P market has been behaving as expected. It looks as if April 15 (Mon) or so could be a low followed by a bounce for a few days until April 18 (Thu) followed by another decline into the April 24 (Wed).
 
 Apr 15 (Mon) Major Low ?
Apr 18 (Thu) High
Apr 23-24 (Tue-Wed) Low
Bounce
May 9 (Thu) Major Low ?
May 24 (Fri) Major High
  Jul 24 (Wed) Major Low
 
Today is April 14 (Sun) and we're looking at this forecast as being very similar. But there are several different variations of this particular pattern. The most reliable one so far has been the year 2000 market. It is repeating almost exactly what happened in April of 2000 and that low came in on April 14. But we are looking for a low around April 23-24 (Tue-Wed), another bounce and another low around May 9 (Thu). The May 9th low may not be lower than the market is right now.


The analogs we're using are the year 2000, the 1996 market and the 2006 market. All of which are connected to the present market and you can see the overlap of the 1996 and the 2006 markets and how they go forward is extremely similar but not identical.

They both have a high late May, they both have a low late July. But from now until late May they have different variations on how they go forward. So at this point one needs to be cautious about expecting continued lower prices because the fourth wave does not have to be a big decline. It's after the Elliott fifth wave that you'd expect to see a major decline. 
 
After this whole correction phase is over we're expecting a new high by May 24 (Fri), a strong rally in the month of May and then after that a very big decline from May 24 (Fri) down into July 24 (Wed) area. That could be a very significant short position for those who want to go short or at least one once a hedge, one's long positions during that time. After that July low the market should again rebound strongly and by the end of the year make new highs.

So we're looking at a fourth wave correction which is probably going to end either in the next two weeks or it could be as late as 
May 9 (Thu) and then the fifth wave rally until late May followed by an ABC meaningful correction of the whole move from October 27th until May 24th that whole up move should be corrected in the two months after that. So if you're looking for a big decline it's not likely to happen now. It's more likely to happen after the end of May. 
 

Friday, April 12, 2024

S&P 500 Bear Reversal - Gann's Time and Price Overbalance | Robert Miner


YM and RTY have already made Bear Reversal Signal. S&P and NQ should soon confirm. Gann's time and price overbalance signals: A daily close below 5283 would be an 'overbalance of price' and strong signal the trend should be net Bear for 3-4 weeks or longer.


Wednesday, April 3, 2024

ICT Syllabus for Beginners - How to Study ICT on YouTube | Darya Filipenka

This is my personal recommendation to study the ICT YouTube channel. I truly believe that this information is enough to understand how the ICT concepts works.  
 
 
ICT Syllabus for Beginners:

Part 1: 
Part 2: 
After Month 7: 
Part 3: 
Part 4: 
Part 5: Market Maker Models